

Retail Origins for Shopping Centres
Discover which brands attract the most visitors, and how to activate them
Retail Origins™ turns mobility, affinity and behavioural signals into actionable decisions for Asset Management, Marketing and Leasing. Define your true catchment area, identify opportunities to increase footfall and optimise your tenant mix.

Millions of connected signals to
THREE DECISIONS, ONE SOURCE OF INTELLIGENCE
What challenge do you need to solve for your centre?
Start with your most urgent objective. Each challenge draws on the same location signals, but answers a different business question.
Who visits, and where do they come from?
Define your true catchment area, understand your visitor profile and measure your share against other centres in the area.
How can I drive more footfall?
Attributes and categories that show what appeals to the centre’s audience.
Which brands will grow the mix?
Cross-shopping, repeat visitation and the connections between the centre, its retailers and the surrounding area.
01 Asset management
Your catchment area is not a circle:
it is the territory where every visit is decided.
Reconstruct the real catchment area to understand where visitors come from, how often they visit and how much demand you capture across the territory compared with other centres.
Demand origin
The real contribution of each area to the centre’s footfall at any given time.
Share & competition
How much of the territory you capture and who you share it with.
Brand affinity
Where to activate demand and drive footfall for each event.
Area profile
Profile and characteristics of visitors by origin.

02 MARKETING
Discover where and how to activate
for maximum impact.
Turn catchment area signals into key audiences, activate them with the right message and media mix, and use the results to optimise the next event.
Where and who
Aggregated signals that reveal origin, repeat visitation and behaviour across the area.
Activation
A channel mix adapted to the area, the objective and the audience.
Measurement
Footfall Attribution™ measures footfall attributable to digital activity, while Coverage Study™ measures out of home reach.
EXPOSED AREAS STUDY
+14 %Exposed areas increased during the week of the event compared with the previous period.
03 LEASING
Each brand brings something
different to the centre’s ecosystem.
We compare mobility, affinity and behaviour across the area to identify brands that drive performance, operators with room for optimisation and new opportunities for the tenant mix.
Optimise the current mix
Which brands drive footfall and which have untapped potential.
Prioritise new brands
Operators not currently present with proven affinity.
Understand cross-shopping
Which operators attract or share visitors.
Negotiate with evidence
A comparable framework for contribution and opportunity.
INITIAL ASSESSMENT
A practical first look, not another generic demo.
Select an asset and an objective. We will review data availability and work with you to define the scope of the initial assessment.
Initial assessment of the centre and its surrounding area.
Key findings related to the selected objective.
Visualisations that make each insight easy to understand.
A session to review results and next steps.
HOW WE BUILD IT
Four layers. A connected view of the centre.
Signals are aggregated at area level to explain overall behaviour, without the need to identify any individual.
Mobility
Aggregated signals that reveal origin, repeat visitation and behaviour across the area.
Affinity
Attributes and categories that show what appeals to the centre’s audience.
Behaviour
Cross shopping, repeat visitation and the connections between the centre, its retailers and the surrounding area.
Contribution
A comparable model for identifying traction, optimisation potential and opportunity.
FEATURED CASE STUDY
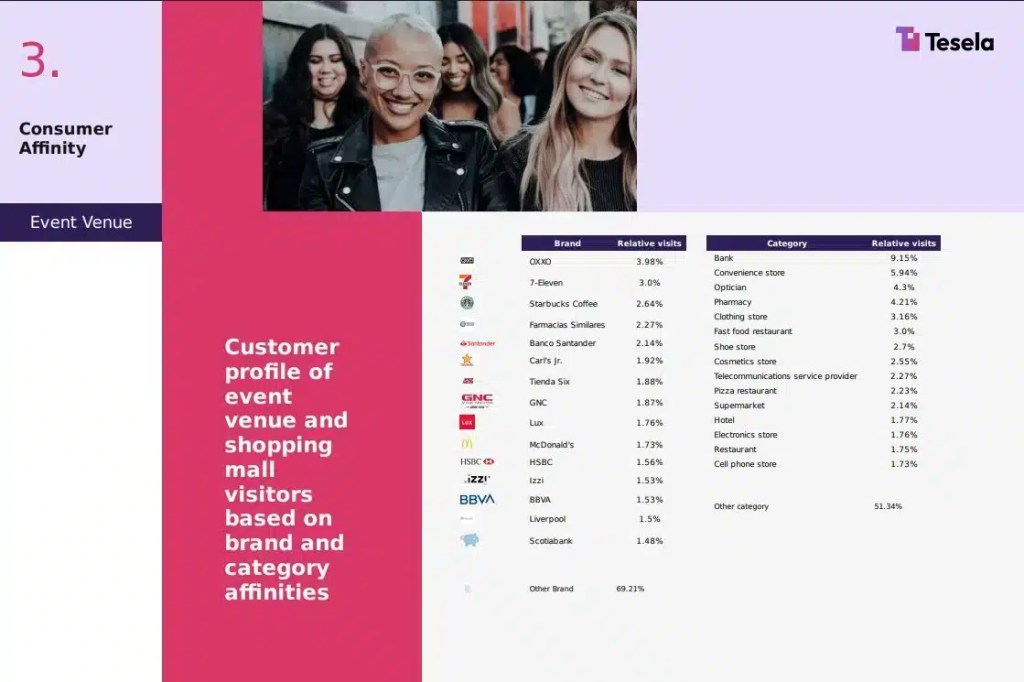
Turning Christmas events into visits
In Mexico City, a leading shopping centre wanted to understand how its Christmas events influenced visitor flows and behaviour relative to competitors.
More information
FIRST STEP
Start with the decision that matters most at one of your centres.
Select an asset and we will prepare an initial assessment based on your chosen objective: understanding its catchment area, identifying footfall opportunities or assessing the potential of its tenant mix.
Tell us which centre you want to analyse
We will review data availability and contact you within 48 working hours.
By submitting this form, you agree that Tesela may contact you to manage this request. See our privacy policy.